Last year, the US Mint has been under a lot of scrutiny for how they handled gold bullion sales. I tried to find any positive story for the US Mint’s handling of bullion coins. Regardless of the search string I fed into several search websites, I did not find any positive article. Even though the US Mint continues to have problems supplying bullion to the market, I began to wonder if there was a deeper reason that may explain the situation.
Starting with the hypothesis that the shortage of American Gold Eagle bullion coins was because of record high mintage demands, I started by collecting the mintage totals for all American Eagle bullion coins from the US Mint’s website. I am limiting my study to bullion coins because of the difference in striking, handling, and selling collectible versions. I am also not including Gold Buffaloes since they make up less than one-percent of the total number of gold coins produced by the US Mint.
The US Mint does not make downloading mintage data easy. While the numbers are nicely displayed on their website, they do not provide a way to easily import that number into a database or spreadsheet. Using my programming skills, I was able to download the HTML files and extract the numbers. It would be nice if the US Mint would provide a way to download the raw numbers.
Counting Gold Coins
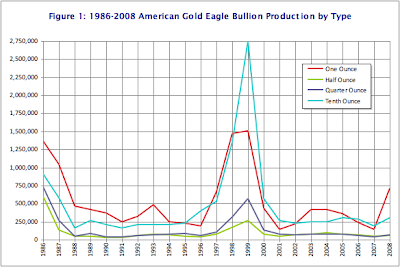
In 27 years of production the US Mint produced over 28.4 million American Gold Eagle bullion coins using over 15.1 million ounces of gold. Over 12 million, or 42.5-percent of the production has been one-ounce coins while more than 10.8 million, or 38-percent are in tenth-ounce coins. Half and quarter-ounce coins combined make up less than 20-percent of the total production of American Gold Eagles. Figure 1 graphs the sales of American Gold Eagle coins.

As with most new coin series, the first year of issue started strong then trailed off the next few years. Our graph in Figure 1 shows that significant changes started in 1998 and continued until 2000. This was the time of the Internet boom when companies were spending money on technology related projects when budgets swelled in fear of the dreaded Y2K Bug. Technology company sprung up like weeds with no business plan, went public with initial public offerings whose prices prompted then Federal Reserve Chairman Alan Greespan to call the run up irrational exuberance, only to crash by 2001.
The economy began to slow after Y2K fizzled but not that slow as the technology industry focused on the potential Leap Day Bug. Usually, every 100 years there will be no leap day on the last year of a century except every 400 years and the last year of a millennium. The threat of the Leap Day Bug continued technology spending but at a slower pace. The economy showed tentative strength through the end of the quarter before showing a slowdown as technology spending slowed.
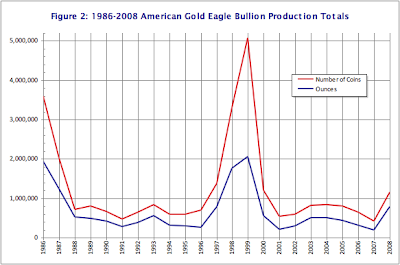
With all of the money entering the market, people were looking for areas for investment. Aside from the irrational exuberance, there were a significant number of investors looking to buy assets to hedge against potential tragedy. Since gold has always been a safe haven from potential disaster, the US Mint increased their production to meet the demand. From 1997 through 2000, the US Mint struck 10.9 million gold coins representing 5.16 million ounces of gold. Considering gold bullion coins are a generic investment, I thought it would be a good baseline to use the number of coins struck and the amount of gold used as a generic comparison from year to year. Figure 2 shows this comparative bullion production.

Graphs in Figures 1 and 2 illustrate that the US Mint produced a significant number of American Gold Eagle Bullion coins during the 1997-2000 economic run. At the time, the US Mint was under the leadership of Philip N. Diehl (1994-2000) and Jay Johnson (2000). Diehl and Johnson guided the US Mint in the production of 48-percent of all gold coins struck between 1986 and 2000. Although this does not take into consideration the total coin production at the US Mint, the time included the introduction of the 50 State Quarters program which caused a significant increase in the number of quarters produced.
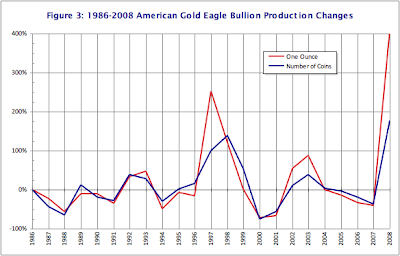
Both graphs show an uptick in production for 2008 where the US Mint reports that they struck over 1.14 million gold coins using 788,500 ounces of gold. This is comparable to the 2000 American Gold Eagle bullion production. But the increase may tell another story. I wanted to figure out what was the difference in production from year to year to see what that says. Figure 3 shows the percent change from year to year.

In 2008, the US Mint produced over 400-percent more gold coins than in 2007 using 178-percent more gold. Since the start of the American Gold Eagle bullion program, there has never been this significant of a change from year to year. But this change was for the year. Was this a steady increase or was there a immediate demand?
Assessing the Demand
Market watchers were greeted on September 8, 2007 with an editorial from the Wall Street Journal saying that 2008 would bring a recession. Citing the credit crunch that began that past July, the editorial said that “tighter credit conditions mean that the drag on the U.S. economy will soon spread beyond the housing sector to affect consumption and investment decisions.” By January 2008, it was reported that Goldman Sachs said that they “[believe] the housing slump and recent credit market turmoil will spill over into the broader economy this year.”
As a result, the spot price of gold rose to over $830 in December 2007, and almost to $930 by the end of January 2008.
According to the US Mint, their best sales month in 2007 was January with sales of 1,650 coins representing 1,208 ounces of gold. As the economy began to turn, the US Mint saw sales increase from 100 coins in September to 1,000 coins in October, and 1,350 in November. There was only a modest increase in sales to 1,400 coins in December 2007 as the US Mint was gearing up for 2008 production.
In January 2008, they reported selling 26,000 coins representing 23,650 ounces of gold. In one month, the US Mint exceeded the sales of gold bullion for all of 2007! Figure 4 graphs the gold bullion production for both 2007 and 2008.

But was this a steady increase or was the growth really a surprise?
Although there were reports we were in a recession, the Dow Jones Industrial Average was still over 12,000 points and gold had a once-per-month spike around $940 per ounce before dropping to $840 with an over $1,000 per ounce spike in March. Sales of American Gold Eagles averaged around 33,000 coins leading up to the summer. Compared to other years, these statistics are unremarkable for the US Mint.
By August, gold dropped to $780 for a brief period and the DJIA dropped to 11,000 points while the financial industry was starting to show significant weakness. Investors started to run for cover in July causing an increase in sales of American Gold Eagles by over 200-percent and an additional 72-percent in August. The rush to buy bullion was too much for the US Mint to handle causing the Mint to suspend bullion sales in mid-August. In September, the markets began to decline, banks and investment houses began to fail, the term “bailout” became prominent in our vocabularies, and the rush for gold strengthened.
We were given our “no kidding” moment when the National Bureau of Economic Research issued a report in December declaring we were in a recession for all of 2008.
Reaching Capacity
In the US Mint’s 2008 Annual Report, they allege that “Production capacity and the volume of precious metal blanks our suppliers can timely provide limit the number of bullion products the United States Mint can produce and sell.” However, the US Mint also noted that there was a decline in the number of business strikes sold as well as a decline in numismatic sales, including the drop in sales of the First Spouse gold coins. There are reports noting even lower production of business strikes this year.
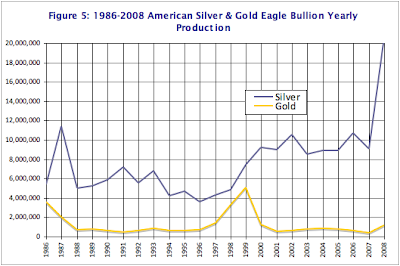
If the US Mint can be accused of modesty in any area it is their assessment of production capacity of bullion coins. According to reports, the US Mint knew that they were experiencing shortage of silver blanks as early as June. Apparently, the US Mint did not tell anyone that 2008 was their best sales year for American Silver Eagle bullion coins. In 2008, the US Mint struck over 20.5 million American Silver Eagle bullion coins. That is a 127-percent increase over 2007’s production and just under twice the previous record of 11.4 million coins in 1987. Figure 5 graphs the dramatic difference in silver production over that for gold.

With the exception of a brief dip in demand during February, production of American Silver Eagle bullion coins remained high as can be seen in Figure 6.

Although the US Mint does not advertise how many coins they can produce over any given period of time, it appears that a significant effort was placed into striking American Silver Eagles over their gold counterparts.
Why Silver Really is King
To understand why the US Mint prioritizes silver over gold is to dig into the how they operate, which is revealed in the 2008 Annual Report. Although the narrative in the report suggests that the net margin for gold is greater than silver, you have to dig deeper to understand the bigger picture.
According to 31 U.S.C. §5116 gold and silver purchased for coinage must be “mined from natural deposits in the United States, or in a territory or possession of the United States, within one year after the month in which the ore from which it is derived was mined.” Gold must be bought from the market at the “the average world price.” If the US Mint cannot purchase the necessary gold, “use gold from reserves held by the United States.” This means that in the event of a gold shortage, the US Mint can use the gold reserves held at Fort Knox to carry out the law.
Silver must also be purchase at the average costs on the world market. However, 31 U.S.C. §5111(b) allows the US Mint to maintain a Coinage Metal Fund to allow the Mint to “invest” in metals in order to maximize profits using dollar cost averaging.
In the FY2008 Annual Report, the US Mint discusses their “Hedging Fund” (Notes to Financial Statements Section 20. Hedging Program, p. 58) that it uses to trade silver shares with partners in order to raise additional capital. The report says that US Mint maintains custody of the silver while the trading occurs. This trading activity yielded $932,000 in profit for FY2008 and $1.3 million in FY2007.
There is no similar program for gold.
The silver trading program makes silver more profitable for the US Mint since they can make a profit by selling lease shares on their non-coinage inventory before making collecting the seigniorage when silver coins are sold.
But We Own A Lot of Gold
According the US Mint’s annual report, the United States is holding 245,262,897 ounces of gold at the United States Bullion Depository in Fort Knox, Kentucky. It has a statutory value of over $10.3 billion dollars (“42 and two-ninths dollars a fine troy ounce” according to 31 U.S.C. §5117(b)).
If there was a shortage of material and the law allows the US Mint to draw from deep storage to make up for the difference, then why did the Mint not withdraw gold to strike coins? Because 31 U.S.C. §5117(b) requires the transfer of gold to the Mint has to be approved by the Secretary of the Treasury, overseen by the Board of Governors of the Federal Reserve, and replaced at the statutory value of “42 and two-ninths dollars a fine troy ounce” when supplies become available. Given the current state of the market, the Mint would not be able to purchase gold for the statutory price $42.2222 fine troy ounce.
What Caused the Shortage
Evidence suggests that the higher demand for silver was a factor in the shortage. However, since the US Mint saw the demand for gold increase as the economy turned in December 2007, and since the US Mint does not keep a large working stock of gold, they were caught without the same safety net as they have with silver and was unable to catch up.
According to reports, the US Mint knew that they were experiencing shortages as early as June. By October, the US Mint announced a shortage of gold and platinum. With the prices rising and the worldwide demand increasing, the US Mint could not purchase enough material at market prices to meet the demand. In other words, the US Mint as unprepared for market demand.
Fixing the US Mint
In 1999, the US Mint announced that not only the Mint experienced increased demand for the American Gold Eagle but announced measures to ensure that the supply would keep up with the demand. In 2008, the US Mint did not adjust their business practices to keep up. Other than changing management at the US Mint, something must be done.
One idea is to change the law to allow the US Mint to have a Hedging Fund for gold. In this program, the US Mint would sell shares for gold in storage on the open market while holding on the physical metal. If the Mint could make an average of $1 million for silver, this would allow the US Mint to leverage stored gold in the same way they leverage stored silver.
In addition to creating a Hedging Fund for gold, the law should allow the US Mint to use the money earned in this program to purchase gold on the open market from any source in the event of a shortage, regardless of where mined. This will allow the US Mint to buy gold from any source to strike bullion coins and maintain their business.
I understand that there may be political implications for this proposal. But when the laws protecting US mining interests were first enacted in the 19th and early 20th centuries, the United States had an abundance of resources and congress passed laws to protect the mining companies, especially as consumer consumption saw a lot of metal leave our shores and not return. The market in the 21st century is more global and the amount of gold resources is not as it was in 1849. Precious metals are globally traded with markets centered in London or New York. It may be time to modernize the laws to allow the Mint to do its business without being held hostage to market forces.
Click on any graph to show larger versions.


8 Comments