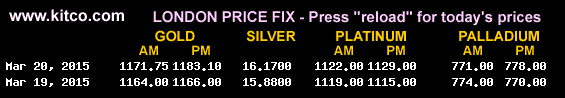
Mar 21, 2015 | bullion, gold, markets, news, palladium, platinum, US Mint
Last day at the London Fix market
The move to an electronic system followed the revelation that in June 2012 an employee of Barclays Bank manipulated the gold fixing process. Unfortunately, it was not an isolated incident. When Barclays was investigated, it was revealed that there were such system and control failures that members of the bank had been manipulating gold prices since they started hosting the market. In May 2014, the Financial Control Authority, the British equivalent Commodity Futures Trading Commission, fined Barclays £26 million for not properly managing the market.
What made the old system susceptible to manipulation was that it was still widely a human controlled process with bidding arbitrarily controlled behind then scenes. Even as the market moved toward a more technological approach, it was as if the technology was being used as the proxy with a human still doing the arbitration. Think of it as if the computers would provide the bidding but there was still an human auctioneer managing the bids.
The new market is electronically run and monitored in cooperation with the LBMA. Rather than a single source being responsible for all of the benchmark prices, the LBMA Gold price auctions are held twice daily by the ICE Benchmark Administration (IBA) at 10:30 AM and 3:00 PM London time in U.S. dollars. IBA is an independent subsidiary of the Intercontinental Exchange (ICE) responsible for the end-to-end administration of benchmark prices. They do not buy or sell commodities but manage the transactions and setting rates based on market forces.
To further diversify the market, the LBMA Silver price auction is operated by the CME Group, a Chicago-based market maker, and administered by Thompson Reuters. The London Metals Exchange administers the platinum and palladium price market. Silver auctions are held once per day at noon London time.
Proponents of the new market system touts its stronger oversight and detailed audit trail capabilities to support the new regulations as making this market more trustworthy than the previous system. Detractors wonder if the new electronic system could create market inequities that was seen in U.S. markets with programmed trading.
News reports suggest that the new market operated without problems on its opening day. In fact, the market saw a rise in all metals by the afternoon auction.
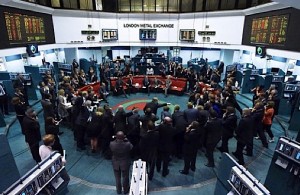
Snapshot of the bullion market on March 20, 2015 (static image, will not update)
Since the U.S. Mint sets its price based on the London market, they sent the following note to Authorized Purchases of bullion products on March 18, 2015:
This is to inform you that on Friday, March 20, 2015 the U.S. Mint will start using the LBMA Gold Price (PM) to price and settle all of its gold bullion coin orders. The new gold price replaces the London Gold Fix and will be managed by the ICE Benchmark Administration (IBA). We do not anticipate any transition issues. Moving forward all gold bullion transactions with the United States Mint will utilize the new LBMA Gold Price (PM) in place of the (PM) London Gold Fix.
While the move will make the markets more transparent and possibly open it to more participants, it is uncertain how this will affect the price of metals in the long term. For that, my crystal ball does not compute!
London Metals Exchange market images courtesy of
Mining.comLondon gold price snapshot courtesy of
Kitco.
Oct 28, 2013 | advice, coins, gold, investment, markets, silver
I always welcome email from readers and the curious but I received an email with an interesting question. My correspondent had become interested coin collecting as an investment and wanted to know if I knew where to find out how much the gold coins would be worth in 10 or 20 years. Channeling my inner Edward Moore (from his play The Gamester) or Dr. McCoy for the Star Trek fans, I replied “If anyone knew the answer to that question they would rich beyond the dreams of avarice!”
This is not the first time someone asked me what I thought would be the price of rare or gold coins in the future. It is also a question that I do not like to answer since I am a collector and not an investor.
Markets are difficult to predict. Even the experts get it wrong. For example, a simple Internet search will find articles that appeared in MarketWatch, Reuters, and The Guardian from the United Kingdom predicting $2000 per ounce prices for gold. In March, the financial site The Motley Fool had an article saying that gold could hit $2000 per ounce next year.
In reality, gold opened the year at 1670.95, the high for 2013 and is 1309.64 as of Friday’s (October 25) close. Even with a small spike in August, the trend is going down. But does the trend mean that gold will still go down?
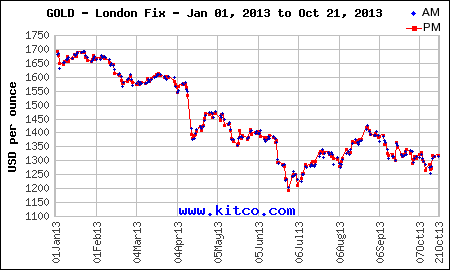
Kitco gold chart for 2013 through October 21, 2013
Trying to read the financial tea leaves has long been a sport for the financial pundits. One pundit writing for Forbes noted that the dollar strengthened while gold and crude oil dropped while last week, another pundit from Bloomberg wrote that stocks and gold rose as the dollar falls on the reaction earnings that have been topping estimates and the prediction of slower economic growth predicted by the Federal Reserve saying it will maintain its stimulus program. In between, an analyst at Yahoo Finance was predicting “a major turnaround in the US Dollar versus the Euro, but gold prices may actually outperform versus the Greenback.”
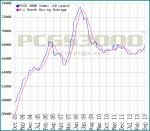
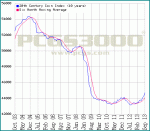
Predicting the price of gold and rare coins can be a similar test of ones nerves. One interesting way to look at the market is to see what the PCGS3000 Index says. The PCGS3000 index uses a sampling of collector coins, type coins, varieties, and differing grades to create a market index. Their sample are considered classic coins (1792-1964) including gold and early commemoratives to total 3000 coins.
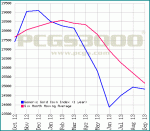
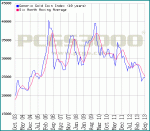
This recent history of collector coins shows an upward trend over the last year as the economy has improved (see graph below on the left). However, looking over the last 10 years (graph below on the right) the peak occurred before the economy turned sour at the end of 2008 and has largely remained flat since falling to a low in 2010.
-

-
PCGS3000 one year graph showing an upward trend
-
-
PCGS3000 ten year chart showing the unpredictability of the coin market
Does this mean gold and rare coins are not a good investment? If you bough during the run up in value in 2008, you are behind. However, coins purchased from the beginning of the ten-year chart should yield a better return for investors.
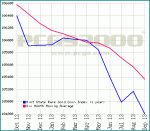
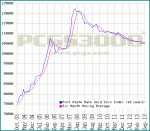
Those thinking that gold coins may be a better investment might want to consider that the price of their coins will be tied to the price of gold. Both the PCGS Generic Gold Coin Index (below on the left) and the PCGS Mint State Rare Gold Coin Index (below on the right) almost mirrors the gold market over the last year. In fact, looking at the 10 year history the Mint State Rare Gold Coin Index almost mirrors the PCGS3000 Index while the Generic Gold Coin Index is all over the place and does not even follow the price of gold for the last 10 years.
-
-
PCGS Generic Coin Index for the past year
-
-
PCGS Mint State Rare Gold coins showing a downward trend
-
-
PCGS Generic Gold Index for the last 10 years shows almost no trend
-
-
PCGS Mint State Rare Gold Index seems to mirror the PCGS3000 index.
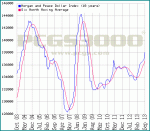
While you are thinking that this may be particular to gold coins, investors in 20th Century Coins (see chart below on the left) and Morgan and Peace Dollars (below, right) may be scratching their heads looking for a better return.
-
-
PCGS Morgan and Peace Dollar Index for the last 10 years
-
-
PCGS 20th Century Coin Index may indicate that coins from our recent past may not be a good investment.
As a layman, what appears to be a hot market is the very high end market. These are the extremely rare coins, coins with extraordinary pedigrees, and unique collectibles. Not every collector or investor is going to be able to own a 1794 Flowing Hair dollar that sold for $10 million last January, the George Walton 1913 Liberty Head Nickel, or a 1880 Coiled Hair Stella which is really a pattern that sold for $2.5 million in September. Even rare copper coins are selling at a premium.
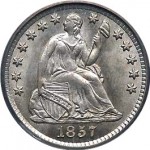
1857 Seated Liberty half dime
Predicting the coin market is more difficult than stocks and commodities. With the capital markets there is company performance data, yield of crops, world conditions, and a lot of measurable factors that the professionals use. None of that exists in the coin investing market. Prices can be predicted by rarity to a certain degree, much of the pricing appears to be based on emotion: what will you pay for the coin. For instance, if the 1794 Flowing Hair dollar sold for $10 million what would the only legal-to-own 1933 Saint Gaudens Double Eagle sell for today? It used to hold the record for the most ever paid for a single coin when it sold at auction for $7,590,020 (including buyers premium and the $20 that was required to monetize the coin) in 2002.
In case you were interested, according to the Bureau of Labor Statistics CPI Inflation Calculator, adjusted for inflation, the price paid for the 1933 Double Eagle in 2002 is $9,867,321.33 in 2013 dollars. Even adjusted for inflation, the price does not beat the 1794 dollar!
If you are interested in trying to test this market, I wish you well. I am a coin collector not an investor. I do not think that will change. However, if you are looking for an interesting investment market, I hear the market for classic cars, including the muscle cars of the 1960s and 1970s are an affordable and growing market. And if you do not want to enter that market for investment, at least you can consider an emotional purchase—like I did!

This 1974 Plymouth Gold Duster with a 225 Slant 6 is a memory that is on a truck on its way to is new home in my garage!
Gold charts are courtesy of
KitcoThe coin market charts are all from
PCGS and their
PCGS3000® index.
Half Dime image from Wikipedia.
Sep 4, 2012 | bullion, gold, markets, news, platinum
Unrest continues in the mining communites of South Africa as the National Union of Mineworkers (NUM) ups their efforts to calm the rank and file. The NUM, an ally of the ruling African Nationa Congress (ANC), have rejected calls to exploit the termoil for the benefit of the workers.
The strike has virtually shut down the Lonmin mine that supplies 19-percent of the platinum to the world.
Gold One is reporting that the wildcat strike that caused four injuries yesterday was open on Tuesday. However, the nearby Aurora mine also owned by Gold One remains closed.
Worker unrest is happening during the campaign for control of the ANC. Former youth leader Julius Malema has been travelling to the effected mines blaming President Jacob Zuma for anti-worker policies and accusing the NUM of partnering with the ANC not in the benefit of the workers.
Malema was expelled from the ANC for “ill discipline.”
Lonmin and Gold Fields stock, already depressed prior to current events, are down even further on the United States and South African markets. Trading on Gold Fields stock in South Africa has been halted on market trading rules.
Currently, gold and platinum prices are trading based on current economic conditions with futures looking at December delivery of these metals. An analyst interviewed for this story said that if the unrest continues, the futures prices will not be affected until late January or early February deliveries are traded—which could begin later in September.
The Coin Collectors Blog will continue to monitor the international reporting and market reaction for their effect on metals prices. Stay tuned!
Sep 3, 2012 | gold, markets, news, platinum

An unidentified mine worker sits on a rock at the Lonmin mine near Rustenburg.
Unrest continues as police used tear gas and rubber bullets to turn back a group of about 60 mineworkers at the Gold One mine at Modder East near Johannesburg who was blocking the roads and throwing rocks at vehicles trying to enter the mine area. Four miners were reported hospitalized by police actions.
 Fear of national mining disruption continues as strikes spread to gold mines in South Africa. Local business leaders are afraid that the strikes will hurt South African mines in the long term causing a ripple effect in the economy. South Africa is the world’s third leading producer of gold behind China and the United States.
Market analysts have been reporting that since they see South Africa as an “investor-unfriendly” country that most investments are in exchange-traded funds (ETF) that helps balance the risks.
Gold futures for December delivery rose $9.60, or 0.6-percent, to $1,697.20 an ounce in electronic trading today. London Gold Fixing PM price was $1,691.50, up $5.50 from the AM fix or 0.3-percent. U.S. markets were closed on Monday for the Labor Day holiday.
AP Photo/Themba Hadebe of striker courtesy of IOL Business Report.
Gold Production graph courtesy of ZeroHedge.
Aug 11, 2011 | gold, markets, silver
With the politics of the economy turning volatile, I tried to keep out of that discussion on this blog to keep the discussion to coin-related issues. But with the price of gold climbing to its highest nominal rates of all time, it is difficult to ignore the market. As I write this, gold is current 1793.20 per troy ounce on the spot market.
Market volatility has been blamed on many fronts. It started with Standard & Poor’s, the rating agency that gave top grades to derivatives that caused the market failures in 2008, downgrading the credit rating of the United States to AA+ from AAA. The word came across the pond that the PIIGS of Europe may not only be too big to fail, but too big to help. The PIIGS are the five Eurozone nations who are either in economic collapse or near one: Portugal, Italy, Ireland, Greece, and Spain.
The more volatile the markets are, the more investors run for gold running up the prices.
But if you think the prices are high, consider what happened on January 18, 1980 when gold closed at 850.00 per troy ounce. That run up of gold came during the time that the Hunt Brothers were trying to corner the silver market as a reaction to the down economy and the rise in the solver market. Adjusted for inflation, $850 in 1980 would be equivalent to $2,328.44 in today’s dollars. If this does not dampen you excitement over the price of gold, you could watch the argument between “experts” who think $2,000 per ounce is possible versus others saying that gold could plummet in value. Consult a profession before you make any investment.
Silver has not faired as well as gold. While trying to figure out why, I found a lot of information that while both metals have industrial applications, gold is seen as a financial metal while silver is more plentiful and is considered a more industrial metal. Rather than investors trying to have silver keep pace with gold, the way gold kept pace with silver in 1980, the old 15-to-1 and even 25-to-1 silver to gold ratios are no longer valid measures. At the current 39.29 per troy ounce, the ratio is 44-to-1. Some believe that 35-to-1 and higher may be the new “normal.”
For a little perspective on the price of silver, it is currently training at 39.29 per troy ounce, down from its high of 48.70 on May 28. That did not pass the nominal close of 52.50 reached on January 7, 1980 when the Hunt Brothers tried to corner the silver market. Adjusted for inflation, the Hunt Brothers ran the price to the equivalent of 143.82 in today’s dollars. Even at a 25-to-1 ratio, the price of gold would have to climb to $3,575 per troy ounce before the value of silver breaks 1980’s records.
In 1980, the Dow Jones Industrial Average closed at 832.00 on January 7 and 867.15 on January 18 before dropping in March. It would take the market until November 20 to close at over 1000 for the first time in its history. After dropping back and flirting with 1000 points a few more times, it would take until 1982 before the market climbed and stay over 1000 points.
What have we learned from this look at history? Not much. At first glance it looks like the economy is not as bad as it was in 1980. But that history was caused by market manipulation. Will history repeat itself? Time will only tell.
