May 16, 2012 | gold, history, rareties, shows
I continue to be amazed with the stories some coins garner. Last week, I received a note announcing that one of the only two known 1907 rolled edge Indian Head $10 Eagle Proof gold coins will be exhibited at the up coming Long Beach Coin, Stamp & Collectibles Expo.
The coin is own by Monaco Rare Coins of Newport Beach, California and has been graded by Numismatic Guarantee Corporation as Satin PR67.
“This important and monumental rarity was not discovered to be a proof finish until several years ago. It was previously misattributed as mint state. The coin now is insured for $3 million,” said Adam Crum, Vice President of Monaco Rare Coins.
According to Crum, there are some researchers who believe that this coins may have been owned by President Theodore Roosevelt. As part of Roosevelt’s “pet crime,” he worked with prominent sculptor Augustus Saint-Gaudens to redesign U.S. coinage. Prior to his death, Saint-Gaudens completed the design of the Indian Head $10 gold Eagle and the iconic $20 gold Double Eagle, both introduced in 1907.
“One prominent numismatist told me, ‘After all the research we did, your coin has to be Teddy’s,’” Crum said. “Obviously, more research is required, but that is what being a numismatist is all about, isn’t it? I look forward to more discovery.”
Even if the coin was not owned by Teddy Roosevelt it is still a great story!
If you are in the Long Beach area, the show runs Thursday and Friday, May 31 and June 1, from 10 a.m. to 7 p.m.., and Saturday, June 2, from 10 a.m. to 5 p.m. Drop by and see this historic coin!
Oct 26, 2011 | foreign, gold, video
Early this morning U.S. time, the Perth Mint unveiled the world’s largest gold coin. The 1 Tonne Gold Kangaroo Coin is made from 99.99-percent pure gold, weighs one tonne (1,000 kilograms or 2,204.62 pounds), is 80 centimeters (31.49 inches) in diameter, and 12 centimeters (4.72 inches) thick. The obverse features Queen Elizabeth II and the reverse features a Red Kangaroo. The coin has a face value of AU$1 million ($1.04 million U.S. Dollars) and contains $55.23 million in gold (at the spot price $1718 per troy ounce).
Perth Mint surpassed the effort by the Royal Canadian Mint whose 2007 CA$1 million face value coin, made with 99.999-percent pure gold, and weighed only 100 kilograms.
Why did the Perth Mint do this? As a publicity stunt, of course. In a video produced by the Perth Mint (see below), the director said that it will be part of their exhibit for the 100,000 people per year who come to visit their facility. Certainly, the chance to see the World’s Largest Coin will be an attraction that will increase the number of visitors.
You can see how the Perth Mint made the coin in their video below.
Aug 11, 2011 | gold, markets, silver
With the politics of the economy turning volatile, I tried to keep out of that discussion on this blog to keep the discussion to coin-related issues. But with the price of gold climbing to its highest nominal rates of all time, it is difficult to ignore the market. As I write this, gold is current 1793.20 per troy ounce on the spot market.
Market volatility has been blamed on many fronts. It started with Standard & Poor’s, the rating agency that gave top grades to derivatives that caused the market failures in 2008, downgrading the credit rating of the United States to AA+ from AAA. The word came across the pond that the PIIGS of Europe may not only be too big to fail, but too big to help. The PIIGS are the five Eurozone nations who are either in economic collapse or near one: Portugal, Italy, Ireland, Greece, and Spain.
The more volatile the markets are, the more investors run for gold running up the prices.
But if you think the prices are high, consider what happened on January 18, 1980 when gold closed at 850.00 per troy ounce. That run up of gold came during the time that the Hunt Brothers were trying to corner the silver market as a reaction to the down economy and the rise in the solver market. Adjusted for inflation, $850 in 1980 would be equivalent to $2,328.44 in today’s dollars. If this does not dampen you excitement over the price of gold, you could watch the argument between “experts” who think $2,000 per ounce is possible versus others saying that gold could plummet in value. Consult a profession before you make any investment.
Silver has not faired as well as gold. While trying to figure out why, I found a lot of information that while both metals have industrial applications, gold is seen as a financial metal while silver is more plentiful and is considered a more industrial metal. Rather than investors trying to have silver keep pace with gold, the way gold kept pace with silver in 1980, the old 15-to-1 and even 25-to-1 silver to gold ratios are no longer valid measures. At the current 39.29 per troy ounce, the ratio is 44-to-1. Some believe that 35-to-1 and higher may be the new “normal.”
For a little perspective on the price of silver, it is currently training at 39.29 per troy ounce, down from its high of 48.70 on May 28. That did not pass the nominal close of 52.50 reached on January 7, 1980 when the Hunt Brothers tried to corner the silver market. Adjusted for inflation, the Hunt Brothers ran the price to the equivalent of 143.82 in today’s dollars. Even at a 25-to-1 ratio, the price of gold would have to climb to $3,575 per troy ounce before the value of silver breaks 1980’s records.
In 1980, the Dow Jones Industrial Average closed at 832.00 on January 7 and 867.15 on January 18 before dropping in March. It would take the market until November 20 to close at over 1000 for the first time in its history. After dropping back and flirting with 1000 points a few more times, it would take until 1982 before the market climbed and stay over 1000 points.
What have we learned from this look at history? Not much. At first glance it looks like the economy is not as bad as it was in 1980. But that history was caused by market manipulation. Will history repeat itself? Time will only tell.
Jul 1, 2011 | bullion, foreign, gold, silver
 The People’s Bank, which governs the creation of coins in China, has announced that because the Panda coins are so popular they will be increasing production. In December, I wrote that the People’s Bank was plannning on a 10-fold increase in production. However, the recent announcement shows a somewhat smaller increase.
The largest increase will be in the 1⁄10 ounce and 1⁄20 ounce gold Pandas with a 4-fold increase. Silver 1 ounce Panda coins will double from last year. Mintages are being reported as follows:
| 2011 Pandas |
2010 Mintage |
New Mintage |
| 1 ounce Gold |
300,000 |
500,000 |
| ½ ounce Gold |
120,000 |
200,000 |
| ¼ ounce Gold |
120,000 |
200,000 |
| 1⁄10 ounce Gold |
120,000 |
600,000 |
| 1⁄20 ounce Gold |
120,000 |
600,000 |
| 1 ounce Silver |
3,000,000 |
6,000,000 |
In some forums, it has been suggested that this increase would mark the fourth generation of the silver Panda coins. One source described the generations as:
| Generation |
Weight |
Content |
Size |
| First Silver Panda Coins (1983-1985) |
27g |
.900 fine |
38.6 mm |
Sterling Silver Panda (1987)
one year issue |
1 troy oz |
.925 fine |
40 mm |
| Second Generation (1988-1999) |
1 troy oz |
.999 fine |
40 mm |
Third Generation (2000-2010)
Change in artists |
1 troy oz |
.999 fine |
40 mm |
Fourth Generation
Increased Production |
1 troy oz |
.999 fine |
40 mm |
Some have called silver the investment vehicle for the masses. Silver has a silky color that allows for striking designs to be very visible. Because silver is less dense than gold, a one ounce coin made from silver is larger than a one ounce gold coin. This means there is a larger surface area for beautiful designs, like the silver Panda.
Silver Panda coin image and production data courtesy of CGCI
May 23, 2011 | commentary, gold, policy, silver
In recent months, there has been a call to either push for a gold standard or watch as states introduces bills coin their own money in response to the economy. On the extreme, Rep. Ron Paul (R-TX) introduced a bill that proposes repeal legal tender laws that will essentially bring the country back to the chaos of the United States pre-constitutional economies. Many of these arguments are interesting with some good and bad ideas, but they do not take into consideration issues of basic math.
If a proposal to move the United States to either a gold, silver, or bi-metal standard passes, we will probably see the biggest economic contraction in history because there is not enough gold or silver in the country’s storage in order to cover the total money supply.
First, in calculating the country’s value of gold and silver holdings, we find that according to the 2010 United States Mint Annual Report [PDF], there are 245,262,897 troy ounces of gold stored in the United States Bullion Depository in Fort Knox, Kentucky. This amount has not changed in recent memory. In the Mint facility at West Point, nicknamed the “Fort Knox of Silver,” the country owns 7,075,171 troy ounces of silver. But what they worth?
Determining the worth of the metals in storage is an interesting exercise. If we valued the government’s total holdings in accordance with statutory requirements, gold is valued at $42.22222 per fine troy ounce (see 31 U.S.C. § 5117(b)) and silver is values at least $1.292929292 per fine troy ounce (see 31 U.S.C. § 5116(b)(2). Although these values are much lower than what the markets value these metals, when the federal government counts its assets, gold and silver is based on numbers written into law.
Valuing these metals based on their market value, gold is worth $1,514.20 per troy ounce and silver is $35.16 per troy ounce (New York prices when the market closed on May 20, 2011). These values significantly raise the value of the government’s holdings. Using these numbers we can calculate the United States’ total holdings as:
|
Gold Statutory Value |
Gold Market Value |
Silver Statutory Value |
Silver Market Value |
| Inventories (troy ounces) |
245,262,897 |
245,262,897 |
7,075,171 |
7,075,171 |
| Valuation per Troy Ounce |
42.2222 |
1,513.20 |
1.292929292 |
35.16 |
| Total Value (in millions) |
$ 10,355 |
$ 371,205 |
$ 9,148 |
$ 247,985 |
| Total Statutory Value: |
$ 10,365 million |
| Total Market Value: |
$371,453 million |
This means that the amount of money the economy can have is over $371 billion. This seems reasonable until we look at the total amount of money that in economy.
Economists have several ways of calculating the money supply in an economy. The Federal Reserve used M1 and M2 as their basis of analysis. M1 is a narrow measure of money’s function as a medium of exchange. In other words, it is the purchase power of all liquid or near liquid assets. M2 is a broader measure that reflects money’s function as a store of value. For the Federal Reserve, M1 is basically the supply of ready cash. M2 consists of M1 plus other deposits that are not as readily available, such as savings and retirement accounts. The economists at the Federal Reserve are constantly updating these numbers to determine how well the economy is doing.
According to the Money Stock Measures published by the Federal Reserve on May 19, 2011, at the end of April 2011, the seasonally adjusted M1 money supply was $1,901 billion meaning that there is just under $2 trillion of ready cash in the economy. The M2 money supply, the count of all cash, is $8,945.7 billion.
When calculating what is needed to back the United States currency with precious metals, this is where basic mathematics shows the potential failure of the policy. If such a policy requires the instant conversion of all ready cash (M1) to be backed by metals, only the first $371 billion of the nearly $2 trillion could be converted. In other words, in order to back every dollar with the country’s store of metals, we are over $1.6 trillion dollars short. To cover the entire money supply (M2), there is a $7.2 trillion shortfall. Simply, there is only enough gold and silver to cover about 5-percent of all cash and equivalents in the United States economy.
In order to break even on the conversion, the country would either have to acquire precious metals on the open market, issue $7.2 trillion in bonds that had to be backed by precious metals to a world that does not have those kind of assets, or find a way to revaluate the dollar so that the total money supply can be covered by the $371 billion in physical assets.
And this only covers current assets. It does not account for any growth!
Regardless of how the metals advocates justify their positions, it would be impossible to back the entire economy with down payment of 5-percent.
Apr 10, 2011 | gold, investment, silver
On January 28, 2011, the spot price for silver closed at $26.68 per troy ounce. That was almost $4 lower than it opened on January 4, the first trading day of the year. Since then, silver has climbed steadily to close at $40.22 on April 8. A rise that has seen the price of silver gain a bit more than 50-percent in value.
Some are wondering if the price of silver could hit the $48.70 it did in 1980 when the Hunt Brothers, Nelson and Herbert, tried to corner the silver market. Although the comparisons are interesting, it would only be a numeric record. Accounting for inflation, the actual value would be $130.80 in terms of 2011 dollar. For a true record, silver has a long way to go!
Since the economic downturn, there have been significant investment in gold pushing prices higher with it reaching a record of $1,469.50 per troy ounce as of Friday’s close. However, silver has remained relatively flat until this year. The one explanation that makes sense is that silver remains a good investment because it is undervalued as compared to gold—called the spread or ratio of silver to gold.
Historically, prior to the deregulation of markets, governments have fixed the spread around 15-to-1, meaning that the price would be set to where 15 ounces of silver would buy one ounce of gold. This changed during following deregulation of the markets. One analyst found that gold was over 100 times more expensive than silver but the price ratio never went below 41.51.
At the beginning of the year, a few analysts commented that silver was prime to rise because of the gold-to-silver ratio was very wide. Some suggested that the ratio should be closer to 25-to-1 even though it has never been lower than 41-to-1. However, as of Friday’s close, the ratio is now 36.29!
Some analysts believe that as the dollar falls in value, the prices of both gold and silver will rise. Projections see gold rising to anywhere from $1,500 to $1,600 per ounce. But because this price is high for some investors, silver looks like a better value and is expected to hit the $50 mark before the end of the year. Given its trend and the nature of the markets, it could reach $50 by the summer.
If you are not an investor but a collector of United States coins from prior to 1965, the value of your collection has been going up. Do you have American Gold Eagles? You might have noticed that some of your coins have more than doubled their original price, even for the one-tenth ounce. Remember when the first Gold Buffalo sold for $650? Now add a $200 premium to the gold spot price to find the current value.
Are you collecting dimes? Just the silver value of the dime is $2.96. Those Kennedy Half-Dollars that your father or grandfather saved from 1964 have $14.80 worth of silver. And those common date Peace Dollars (1922-23) that sold for $20-25 a year ago is now worth $31.65 in silver.
By the way, those 1965-1970 Kennedy Halves that are 40-percent silver contains $6.05 worth of silver.
The analysts who determine and publish the values of coins have been very busy!
I am not suggesting that anyone buy gold or silver as an investment—speak to your investment advisor before doing anything. I am looking at the situation from a collector’s point of view. The rise of prices makes my collection worth more when considering the bullion value and the numismatic premium. Maybe now is a good time to consider selling some of my collection—the parts I am less emotionally attached to—and start over again when metals prices drop. In any case, we certainly live in interesting times!
Jan 2, 2011 | coins, economy, gold, investment, policy, silver
Many things can be said about 2010, but for numismatics and precious metals it was quite a ride. What could this ride tell us about 2011?
Looking at the economy, the real gross domestic product—the output of goods and services produced by labor and property located in the United States—increased at an annual rate of 2.6 percent in the third quarter of 2010. A rate greater than in 2009. Although real disposable personal income increased 0.2 percent through November, the consumer price index rose at a faster rate of 1.1-percent while unemployment reached a one-year high of 9.8 percent in November.
If the slow improving economy and expanding unemployment has you confused, the simple explanation is that if the economy was a bus, it just pulled away from the curb and the driver started to shift into second gear while employment has yet to be allowed aboard. Although economists agree that employment and Consumer Confidence Index are lagging indicators, neither have seen improvement in 2010. Although the politicians are hoping their lame duck legislative efforts will help the unemployed to board the employment bus, it is possible that the bus will be too far down the road to make a difference in 2011. Let’s hope it is not too late!
In an attempt to provide its version of stimulus in 2010, the Federal Reserve’s lowered its discount rates and its ability to manipulate the money supply to try to provide relief. Although the Fed has increased the money supply, the United States dollar has not been significantly weakened against most of the world currencies—although some would say that it was seriously weakened in 2009. While the dollar has fluctuated against other major currencies throughout the year, the dollar has shown marginal only weakness against the British Pound, Euro, and Yen year-over-year while there were no weaknesses against the Reniminbi (or Yuan) because of institutionalized currency manipulation in China. Many economists believe that the avoidance of a dollar free-fall was because of the failure and pending failure of some Eurozone economies and China’s desire to reduce its own inflation concerns. The rumblings to remove the dollar as the standard and benchmark currency that we heard in 2009 subsided in 2010.
To measure the effect of the economy on the numismatic markets, I use the PCGS3000® Index as an indicator. The PCGS3000 Index is a market basket of 3,000 coins that PCGS their analysts believe represents the broad market. The variety of coins makes for a good indicator but as a broad market basket, movement indicates trends rather than a real-time indicator (similar to the Russell 2000).

The PCGS3000 Index opened 2010 with at 68,476.87. After dropping to a 12-month low of 66,886.27 (↓2.3-percent) in August, the index closed at 67,323.11, down ↓1.68-percent for the year. For a market basket that consists of 3,000 non-volatile items made from a variety of metals an in different grades, a downward trend of one-to-two percentage points indicates a weakness in the numismatic market. While some think the markets are strong—and there has been no slow down in the high-end coin market—collectors and some investors are either pushing prices downward or waiting for prices to drop before buying. Like in retail sales, many purchasers are standing on the sidelines waiting for the bargains or the market to settle.
But if the economic indicators do not show weaknesses except in employment, then why should the numismatic market show a weakness? The answer can be summed up in two words: gold and silver.

Some dealers and auction houses have found that the buyers for the high-end coins have continued their strong buying but the rest of the market has not joined them. One of the factors can be that the price of gold has scared many people away. When the markets opened on January 4, 2010, the price was $1,087.50 for one troy ounce of gold. During the year, the price never dipped below $1,050 climbing to $1,420 on December 7 before closing at $1,405.50 on December 30. As a result, investors who bought gold prior to 2010 saw their investment to rise 29.2 during the year. One would think it makes sense that the generic gold coin market would rise with the gold market. But a look at the PCGS Generic Gold Coin Index found that even with gold’s rise through the year, the generic gold coin market also saw a 17.76-percent drop in prices. However, Proof Gold rose only four-tenths of one-percent (0.41%) showing that there continued to be a little activity in the high-end market.

If there was a bull market in 2010 they were running for silver. After opening the year at $16.99 per troy ounce, silver closed at $30.63—a whopping 80.4-percent increase! Although less than the $54 ($143 adjusted for inflation in 2010 dollars) that it reached when the Hunt Brothers tried to corner the silver market in 1980, the 2010 rise is significant because few believe that the markets are being manipulated. In fact, one analyst believes that the silver market is undervalued as compared to the gold market. He said, “The gold rush of the 2000s is going to be nothing [compared] to the silver rush of the 2010s.”
When looking at the numismatics market, silver is the key metal. Up until 1964, every dime, quarter, half-dollar, and non-gold dollars were made of silver. Silver has been a key coining metal since the creation of the United States Mint in 1792. Many of the most collectible coin ever created by the U.S. Mint were struck in silver. Nothing represents silver coins like Morgan and Peace Dollars. Arguably one of the most popular numismatic collectibles, Morgan and Peace dollars are 26.73 grams made of 90-percent silver and 10-percent copper making its melt value $23.03 at the end of 2010.
But the value of Morgan and Peace dollars extend beyond their melt value. Morgan and Peace dollars are tied to the late 19th and early 20th century history of silver manipulation in the United States with designs popular with collectors. Morgan dollars struct at the Carson City mint are amongst the most desired. Since the GSA sales in the 1970s, the prices of these coins have gone up—in some cases beyond the reach of the average collector. Of the Peace dollar series, the high-relief 1921-D dollar is very desirable as is the low mintage 1928 dollar, and the 1935 last year of issue dollars. And the rumor that not all of the 1964-D Peace dollars were melted makes finding out the absolute truth a great interest to the numismatic world. However, with the rest of the market trending downward and silver skyrocketing, the PCGS3000 Morgan and Peace Dollar Index found the market rise-then-fall-then-rise again to end the year up eight-tenths of one-percent (0.825-percent) for 2010. Not a great showing, but demonstrating that Morgan and Peace dollars are still popular amongst collectors.
What is clear is that the coin market was down in 2010 while investors and even some collectors might have been concentrating on gold and silver bullion.
In speaking with some dealers, many have said that they have survived the last two years buying and selling bullion including American Eagle coins. One said that the numismatic market has been very slow that the bullion market has allowed him to stay in business during this era being dubbed “The Great Recession.”
Just because the calendar turns does not mean the market will turn along with it. Even though the lame duck congress passed significant stimulus legislation, it will take some time for those measures to settle into the markets. Some experts think that the eventual hiring may not occur for at least six monist and that there will not be a significant drop in unemployment until the fall. Others point to the infrastructure project the new laws are supposed to support forgetting that even shovel-ready projects have legal requirements, such as contract and environmental restrictions, that have to be address before a shovel can be used. In short, we may be in for more of the same through the first and even second quarters of 2011.
The new congress will help keep the economic uncertainty alive. Although the Republicans will control the House of Representatives, the Senate will be controlled by the Democrats with an active Republican minority who has shown that they will use the body’s rules to try to force their will. In other words, prepare for gridlock. None of this takes into consideration that Rep. Ron Paul (R-TX) will be the chairman of the House Finance Committee, thus allowing him to have control over economic policy in the House!
Neither the lame duck stimulus or the new congress will do anything to settle the markets in the short term. With the uncertainty, investors will continue hedge their bets using precious metals. Gold will continue to rise but at a rate less than in 2010. It is fair to say that with the current valuation being so high, it is likely that 2011 will end with gold only rising by 20-percent. However, the argument that the gold-to-silver ratio is out of balance being very compelling, we may see silver continue to climb. Silver may not climb at the 80-percent rate we saw in 2010, but a 40-percent rate may be reasonable. If this holds true, this time next year we could be talking about gold being $1,680 per troy ounce and silver closing at $42.
During the Fall of 2010, the PCGS3000 Index rose a bit from its low for the year and the low since the index’s all-time high in 2008. But with other factors not changing in the short term, could this be the coin market’s version of a “dead cat bounce?” A dead cat bounce is a small yet brief market recovery derived from the idea that “even a dead cat will bounce if it falls from a great height.” It is more likely that the numismatic market will flatten a bit while the rest of the markets figure out which direction they will go.
The first indication of how the numismatic market starts the year will be at the F.U.N. Show held January 4-9 in Tampa, Florida. With F.U.N. being one of the largest non-ANA shows of the year, sales and dealer impressions will set the tone for at least the next few months. Under the premise that markets do not turnaround quickly and that the last major show, Whitman Baltimore Expo in November, saw only nominal sales, one can assume a similar atmosphere for F.U.N. It will be more reasonable to wait until the National Money Show March 17-19 in Sacramento and the Whitman Baltimore Expo held March 31-April 3 to determine if the numismatic market will be better in 2011. At the end of the year, it is reasonable to expect that the PCGS3000 Index will be up 2.5-percent by the end of 2011 given the other market forces.
Of course predicting any market is a total crap shoot. While my roll of the dice may be no better than others, I would caution against thinking that my crystal ball is clearer than anyone else’s. All I have done is read the proverbial tea leaves and drank the tea while throwing darts at the wall trying to guess what the future will bring. Or as one comedian used to say, “That’s my opinion, I could be wrong.”
Metals charts courtesy of Kitco.
The PCGS300® Index courtesy of the Professional Coin Grading Service.
Dec 20, 2010 | bullion, gold, video
Town Center Mall in Boca Raton, Florida is not a run-of-the-mill shopping plaza. With upscale stores like Neiman Marcus, Bloomindale’s, Nordstrom, and Tiffany and Company, there are plenty of opportunities to overspend this holiday season. Now, you can diversify your portfolio by buying gold… from a vending machine!
PMX Gold LLC, the wholly-owned subsidiary of the mining company PMX Communities Inc. worked with Ex Oriente Lux AG to bring the Gold to go® vending machine to the United States. Installed at the Town Center Mall, the machine will dispense 1 gram, 5 gram, 10 gram, 1 ounce, and 250 gram gold bars from Credit Suisse; 1/10 ounce, 1/4 ounce, and 1 ounce Krugerrands; and 1/10 ounce and 1 ounce American Eagle Gold bullion coins.
Gold is dispensed in a black gift box whose price is based on the current spot price that updates wirelessly every 10 minutes. Customers are guided through their purchases using a touch screen that allows them to select the amount of gold they want to purchase. PMX Gold LLC and Simon Properties, owner of the Town Center Mall, will make money of a commission that ranges between 4 and 15 percent depending on the item’s weight. Currently, the machine only accepts cash, but that may change in the future.
The machine will be guarded by am armed security person and monitored by cameras.
This report was broadcast on WPTV, News Channel 5 in Orlando:
Another video from the Orlando Sentinel:
Gold to Go made news when it installed its first Gold ATM at the Emirates Palace in Abu Dhabi. Currently, there are 11 machines in Germany, one in Spain, Italy, United Arab Emirates, and now the United States. Ex Oriente Lux reports that their machines in Europe take in 250,000 to 300,000 Euros per month.
Thomas Geisslei, CEO of Gold to Go, say that the company wants to install more than 30 machines within the United States in the next year. This way, you can decide whether you want that latte or a gold bar.
Oct 7, 2010 | Eagles, gold, US Mint
Ready… Set… BUY!
If you forgot, the 2010 American Eagle Gold Proof coins are now onsale at the U.S. Mint’s online catalog. The one ounce proof coin in display case will open at $1,585. The half-ounce coin opens at $806, quarter-ounce is $415, and the one-tenth ounce coin is $180.50. Opening price for the four coin set is $2,938.
As with other bullion coins, the U.S. Mint will reprice their products on Thursdays depending on market conditions. Gold spot price is currently $1333.90 as I type this—about an 18.8 percent premium.
Oct 3, 2010 | Eagles, gold, palladium, platinum, silver, US Mint
In a rare swift move by the House of Representatives, H.R. 6166, American Eagle Palladium Bullion Coin Act of 2010, was introduced, discharged from the House Committee on Financial Services, considered on the floor, and passed without objection. With its passage in the House, the bill was Engrossed and sent to the Senate for consideration.
In the Senate, the bill was read twice and referred to the Committee on Banking, Housing, and Urban Affairs. Congress has adjourned for the election season.
H.R. 6166 was introduced by Rep. Denny Rehberg (R-MT), the representative at-large from Montana. Montana is home of the Stillwater Mining Company, (NYSE: SWC) the only producer of palladium in the United States. Stillwater also owns platinum mines that supplies the U.S. Mint with platinum for American Eagle Bullion coins. With this bill, Rehberg adds his name to a long line of congressmen who have introduced bills to protect their state’s mining interests by using the U.S. Mint as a primary purchaser.
In the world of metal investing, palladium is behind gold, silver, and platinum in demand. Palladium is not as popular in the United States as it is in other countries. Palladium sells better than silver in Canada and Europe. It is rarer than gold, but a little more abundant than platinum but has the silky look of platinum while being almost as ductile as silver. Artists in Europe and Asia are beginning to use palladium instead of platinum for their higher-end designs.
Since the price of palladium is less than the price of gold and platinum, it is possible that investors could consider palladium as part of a diverse portfolio. Those who believe in “end of the world” scenarios will not be interested because the secondary market is not as strong as it is for gold.

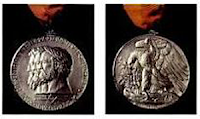 The bill requires that “the obverse shall bear a high-relief likeness of the ‘Winged Liberty’ design used on the obverse of the so-called ‘Mercury dime’” making it yet another bullion coins using a design from the early 20th century. For the reverse, the law says that it “shall bear a high-relief version of the reverse design of the 1907 American Institute of Architects medal.” Both the Mercury Dime and 1907 AIA medal were design by Adolph A. Weinman, whose Walking Liberty design is used on the American Silver Eagle coin.
In other words, congress saying that it does not trust the U.S. Mint to create a design suitable for this coin. While some might have an issue with the design of recent coins, it would be nice to unleash the creativity of the U.S. Mint’s artists and allow them to make a design to represent Liberty. Maybe if the artists were less constrained, they can use their talents.
Another provision of the bill is that aside from using palladium from U.S. sources, it allows the U.S. Mint to purchase palladium from other sources. The bill also makes a distinction between proof and bullion coins allowing the U.S. Mint consider minting proofs to meet collector demand… or not depending on whether there is a demand and a supply to meet the demand. In other words, it will be up to the government lawyers to figure out what is meant by the wording in the bill!
If the bill passes the Senate and signed by the President, palladium bullion coins will not be issued until 2012 because it is too late in the year for the U.S. Mint to plan to issue this coin.
1938 Mercury Dime image is owned by the author.
Image of the 1907 AIA Medal copied from Architecture: celebrating the past, designing the future by Nancy B. Solomon.
![[Most Recent Quotes from www.kitco.com]](http://www.kitconet.com/images/sp_en_6.gif)

